
Exploring Load Testing With Azure Load Testing
Load testing is a crucial test that needs to be done to predict system behavior under load and to design a robustness and scalability strategy. There exists different tools to perform load testing and since February 2023, Azure Load Testing is generally available. In this article, we will talk about load testing, its different types and see how we can implement some of them using Azure Load Testing.
What is Load Testing?
Load testing is a general term that is used to designate all type of performance tests that assess the behavior of a system under a specific load. In web application, the load is usually defined by the number of requests or the number of parallel users. Depending on the scenario and the type of the application, one or many test load type can be performed :
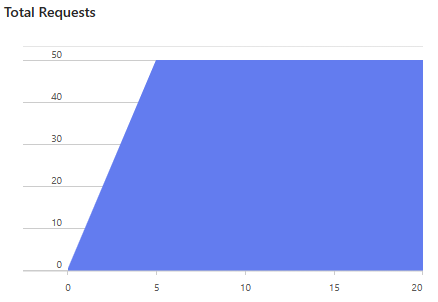
- Average-Load Testing : The system is put under a constant load that is the average load of the production environment.
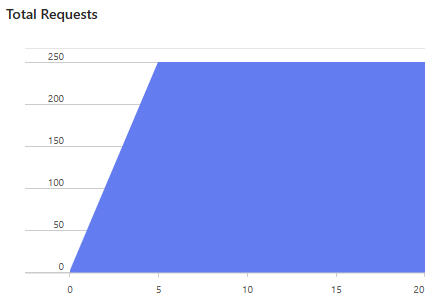
- Stress Test: The system is put under a constant heavy load (above average) that ca be expected during exceptional period of time or events(e.g. sales period for an e-commerce website)
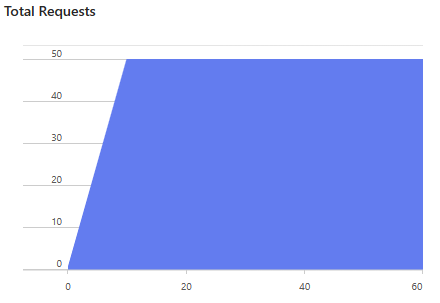
- Soak Testing: It’s similar to the average-load test but the duration of the test is longer (notice 60 minutes instead of 20).
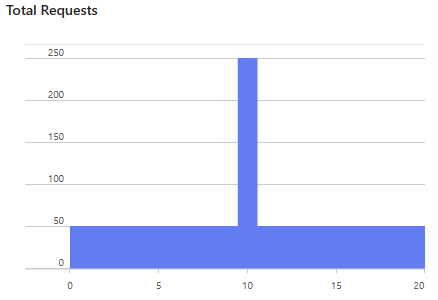
- Spike Testing: The system is put under a higher load in a very short period of time, this will help assess the the behavior of the system when there are sudden unexpected loads (e.g. the time of an ad airing) and to potentially adjust scalability rules.
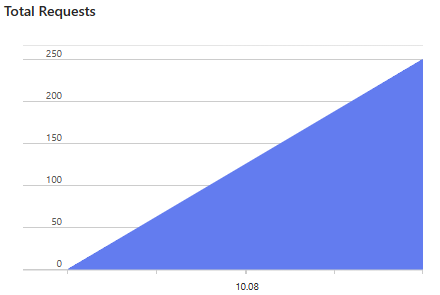
- Breakpoint Testing: The load keeps increasing overtime until the system fails, with it we can know the limits of the system. The breakpoint of the test is when the amount or type of errors reaches an unacceptable state.
What is Azure Load Testing?
Azure Load Testing is an Azure managed service that became generally available on February 2023. The service allow generating high load for applications. It can be used with both application hosted in Azure or elsewhere. It has many advantages and benefits that makes it a good alternative to other tools.
Ease of use
The service comes with an azure portal interface that we can use to define the load test with all possible test parameters, like number of virtual users or number of requests per seconds. This make the service usable without prior knowledge of a performance test framework or language like JMeter scripts.
Alongside the test creation and configuration part, there is also the managed side that eliminates the need to manage the infrastructure needed to perform the load test.
Integration with Azure services
Since the service is an Azure service, it integrates well with applications hosted within azure. it can be integrated with the network boundary like a VPN, it can collect logs, metrics and traces from Azure monitoring tools, like azure application insights.
It’s also possible to integrate the load test in CI/CD pipelines, to ensure no performance regression occurs, and SLA/SLO are not breached.
Practical Dashboard
The result of the tests are displayed in the portal as a visual dashboard that makes it easier to see important insights and to identify patterns that can be converted to actions in order to increase the robustness of the system.
The dashboard also allows us to run queries and apply aggregations to the test result, which is an important aspect of any performance tests.
How to create a load test with Azure Load Testing
The application that we are going to test in this article is the simple ASP.NET Forecast API deployed in an Azure web app service.
Azure Setup
First thing to do is to create the Azure Load Testing instance, from the azure portal. Once the resource created, we can navigate to it.
At the time of writing, Azure Load Testing supports two different way to define load tests, using the Portal or using a JMeter script. Through the portal UI it’s only possible to generate HTTP requests for now.
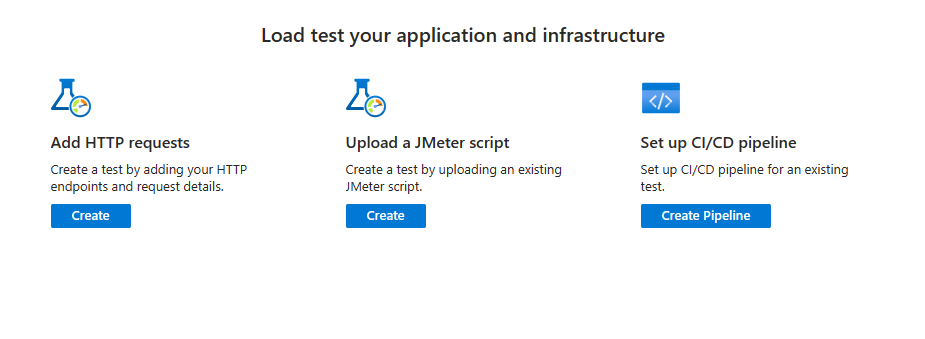
In this article we will use the HTTP requests option, since it’s easier and it’s suitable for most web applications.
Request Setup
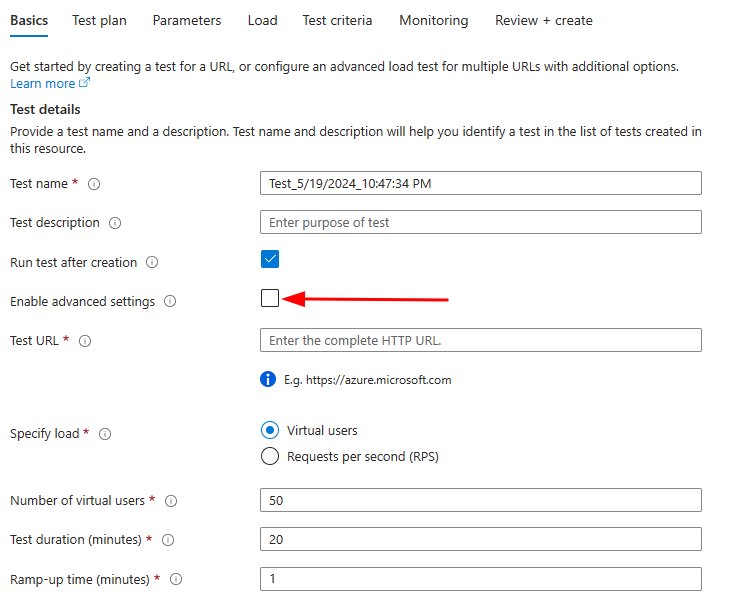
Azure Load Testing comes with two kinds of test setup Basic and Advanced. The basic setup can be used to test HTTP GET requests and it has limited set of configuration parameters.
The advanced mode on the other hand gives more flexibility, like testing all kind of HTTP Methods (Get, Post, Put, etc), fine tuning of the load shape and, the possibility to configure the VPN integration.
To enable the advanced mode we need to check the option for it in the Basics tab:
In the Test Plan tab we can define the request we want to test, by clicking “Add request”:
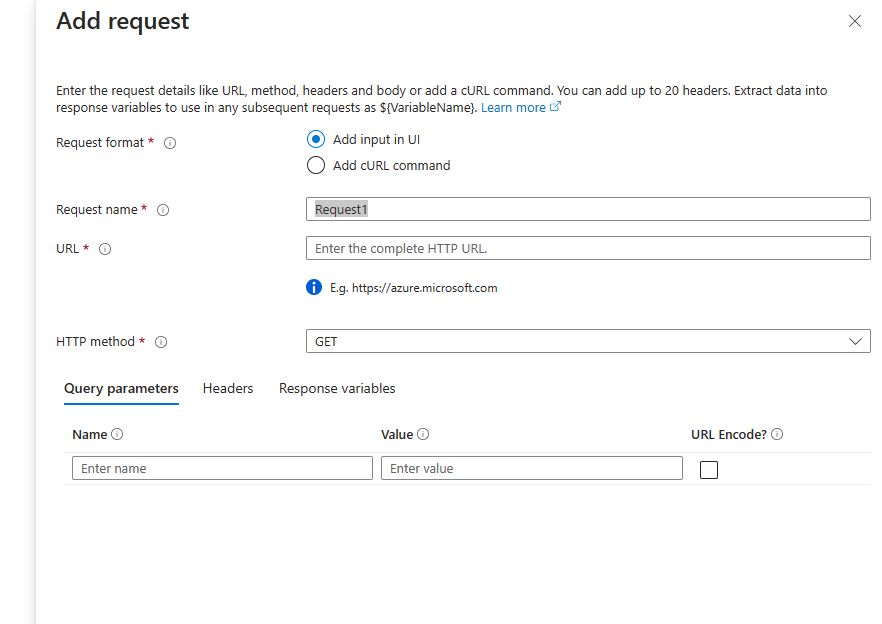
We can either configure the request using the UI or a curl command. using the advanced mode is more practical since in real life scenarios we usually have application that need authentication headers and we have REST API that use all HTTP Verbs.
It’s also possible to run up to 5 different routes calls in a single test.
In the same tab we can upload files that contains our requests payload in case we want to vary the request body.
In the Parameters tab we can have secrets, environment variables and certificates, these can be used to parameterize the requests, for example we can store the Bearer token in the key vault and reference it in the secrets section then we can reference it in the “Add request” step using the syntax ${name of parameter}. (e.g. ${token})
Load Testing Setup:
The other important tab is the “Load” Tab, it’s within it that we configure the different tests parameters and based on that we can have the different tests that we mentioned earlier. The following represents the configuration of a spike test:
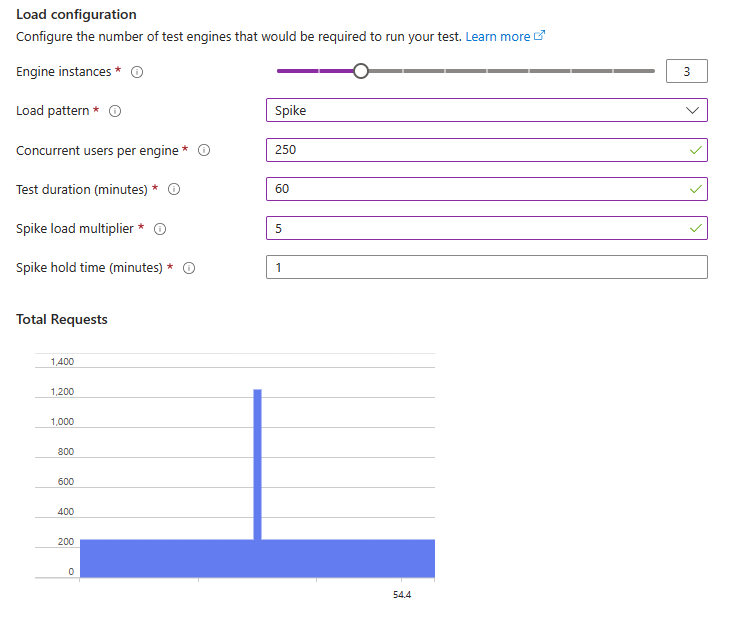
The values of the parameters is application dependent but it is important to understand the importance of each one.
The engine instances is the number of engine instances that we run the test, each engine is isolated so tests run from different engines run in parallel. The region of the instances is similar to the region of the Azure Load Testing resource. It’s important to have multiple engine instances to ensure that the engines are not the bottleneck and that our load test results won’t be skewed by the performance of the engine instance.
The Concurrent users is the number of user per engine instance. In the example above I will have 250 virtual users for each test instance, that means 250 * 3 = 750 virtual users in total will request my servers.
In the “Test Criteria” tab we can configure criteria to determine if a test fails or succeeds and whether we want to stop the test or not when a failure happens. For example, when doing a breakpoint test it’s important to know the exact moment when failure happens to know the breakpoint.
The last important Tab is the “Monitoring Tab”, here we can add specific resources that we want to monitor during the test, for example an Application Insight of the service under test.
Running the test And result Analysis
After the configuration we continue with running the test, while the test is running it’s important to monitor the engine health, to make sure that the tests won’t be impacted.
After the tests ends, either with success or with failure of one of the Test criteria we defined. We can see the the client side metrics (from the engine point of view) and the server side metrics, these are the metrics we added in the “Monitoring section”.
It’s important to have both to assess network delays and latency especially if we are measuring performance from a specific region.
Alongside, the complete data, Azure presents a summary of the test, which is very informative:

On the client side metrics, it’s possible to chose the aggregation that we want to see, like P90, P99, the count, etc of each metric.
And on the top bar under the “Configure Metrics” we can customize the server-side metrics, to define other metrics and their aggregations for the monitored services.
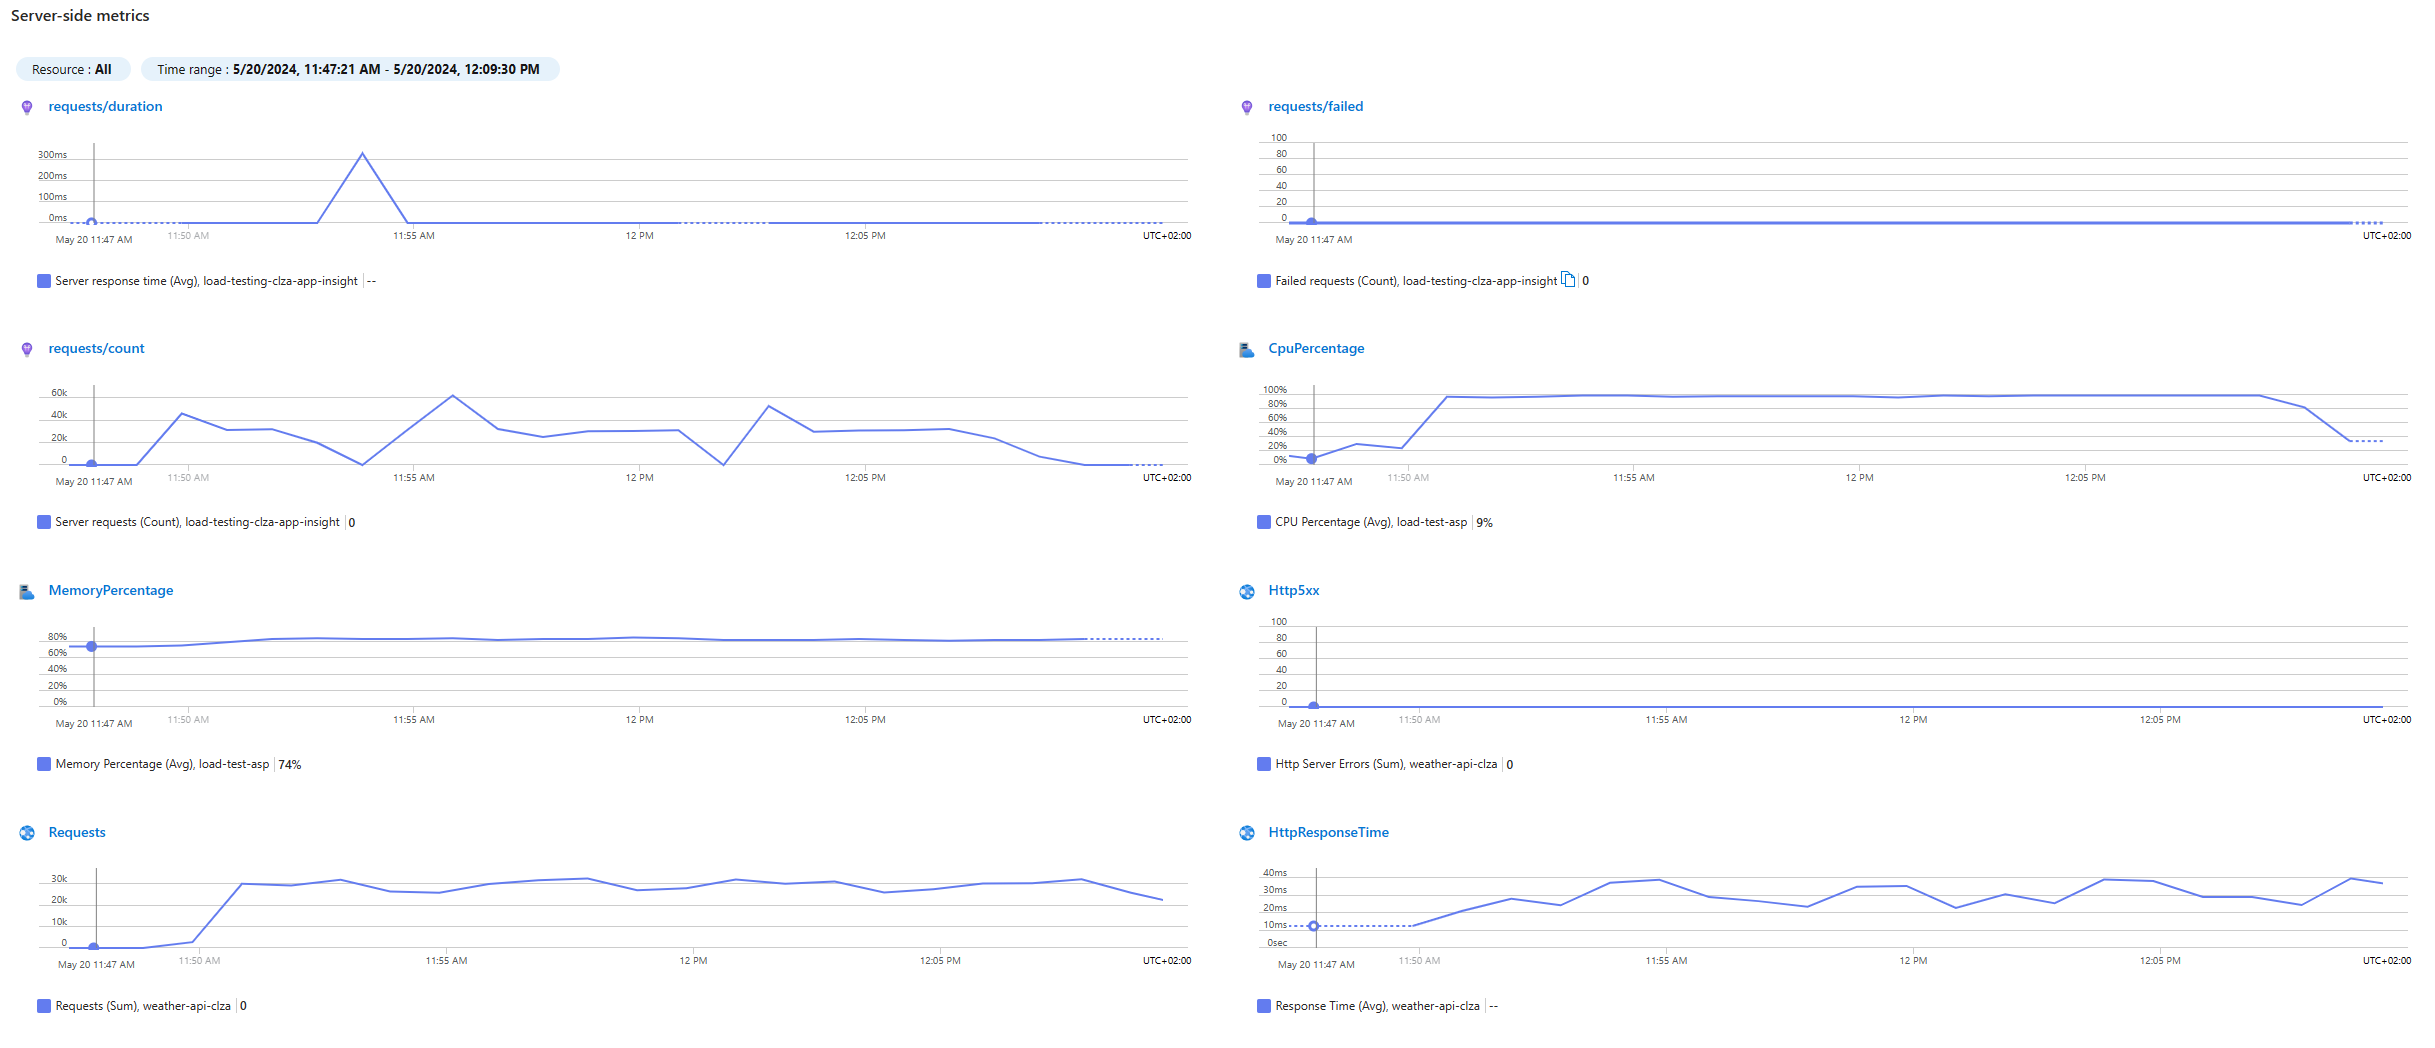
By Default, Azure shows some important metrics:
- Response time
- Failed Requests
- CPU Percentage
- Requests count
- Virtual Users (for the client side only)
Seeing the metrics on a single dashboard like this helps with drawing conclusions easily and detect correlations.
Analyzing the result of the test is a large topic and requires and article by its own in the future. We will stop here for now and let’s talk about the cost of the service.
Service Pricing
The exact price changes from region to another, but the price is measured in VUH - Virtual User Hour, in France Central region, there is a base price that includes 50 VUH per month, which means we can run a test of up to 50 virtual users for an hour each month. It’s also possible to add to the base quota with an additional cost (e.g. 0.141 € per additional VUH)
The cost can vary and it’s not possible to include in the article without the risk of being outdated, it’s good to always consult the Azure website for the exact pricing.
Key takeaways
To have a good performance load test, it is inevitable to have some complexity that comes from managing the required infrastructure, ensuring Geo-distribution similar to production scenarios, having multiple parallel virtual users and collecting and aggregating metrics.
Azure Load Testing make this very easy, with some configuration, we can have a good performance test without having to manage every aspect of it, and gives us more time to focus on the very important part which is test design and results analysis.
In this article, we looked at what load testing is and what are its different types and we also looked at how to start using Azure Load Testing with an overview of the different functionalities it has.